Changes to Your Dashboards
What’s new in this release:
-
Updated metrics:
-
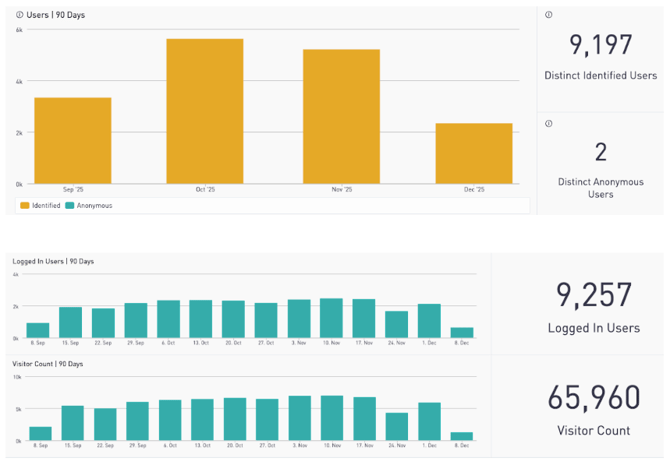
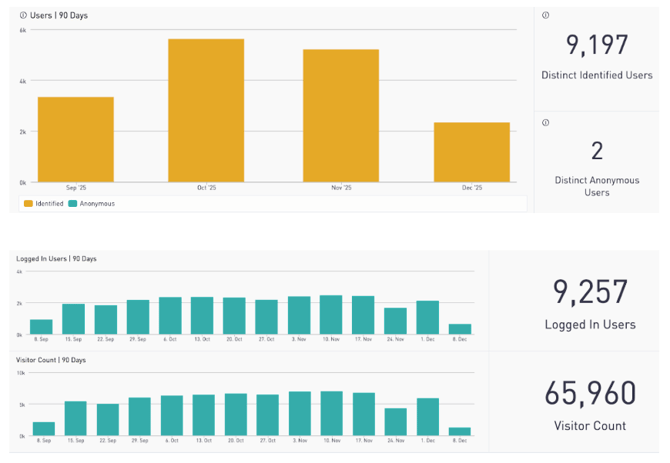
Logged In Users replaces Identified Users and reflects the distinct count of user IDs with one or more login events within a selected timeframe.
-
Visitor Count replaces Anonymous Users and captures the number of unique visitors to the site, including both logged-in and non-logged-in users.
-
-
Chart improvements across existing dashboards for clearer, more consistent insights.
-
Faster, more reliable performance: Dashboards now display data from the current year plus the previous three years to improve load times.
Dashboard Name: Site Activity
A. Logged In Users and Visitor Counts are replacing Identified Users and Anonymous Users respectively.
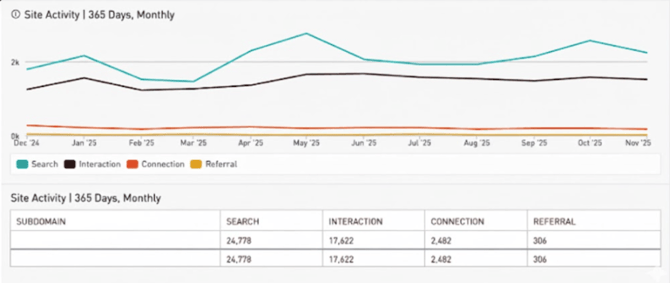
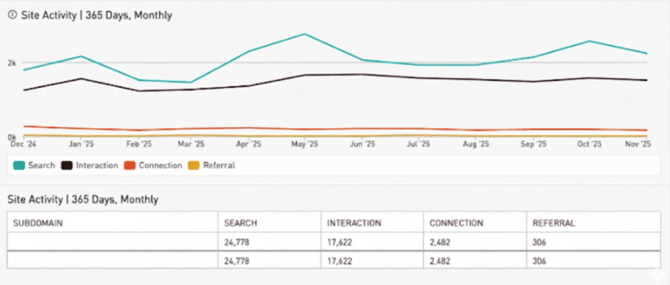
B. Searches, Interactions, Connections, and Referrals are consolidated into a single chart, and a new table chart has been added.
C. In an effort to focus on core metrics, Sessions, Navigator Care Management, and Program Management Activity charts are removed from the dashboard.
Dashboard Name: Referral Activity and Group Based Referral Activity
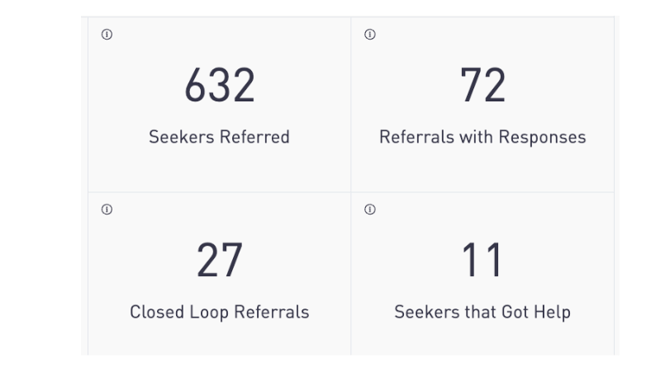
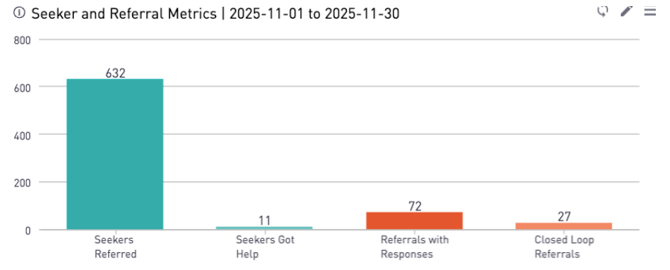
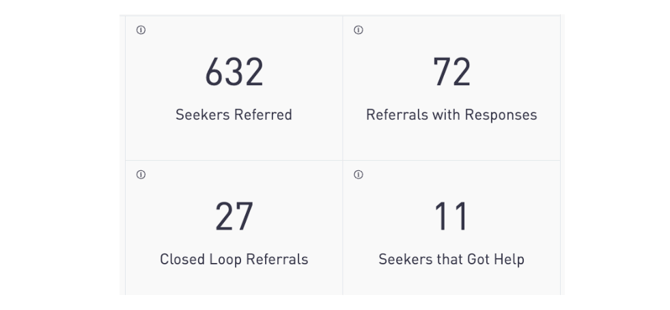
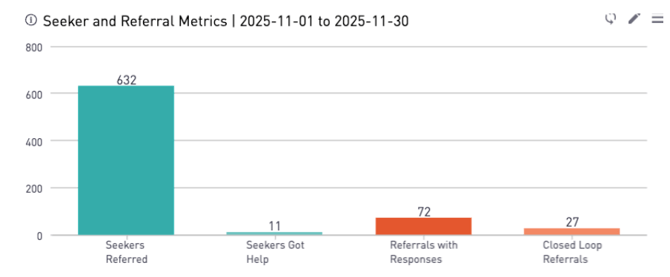
A. Seeker and Referral metrics have been updated from 4 number blocks to one chart.
B. The Most Referred to Programs chart is limited to the Top 50 most referred to programs.
C. The Referrals Heat Map is removed in the RDW dashboard.
D. The Shares and Connections chart is removed in the RDW dashboard.
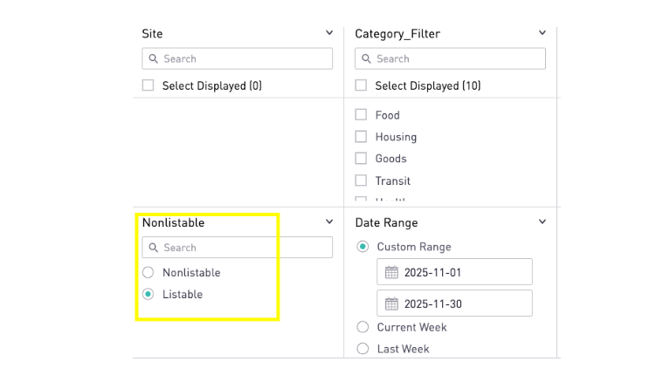
Dashboard Name: Program Summary
A. A Nonlistable filter has been added, which defaults to listable programs.
B. Removed Service Area chart.
Dashboard Name: Premium Insights
A. Logged In Users and Visitor Counts are replacing Identified Users and Anonymous Users respectively.
B. Searches, Interactions, Connections, and Referrals are consolidated into a single chart, and a new table chart has been added.
C. Seeker and Referral metrics have been updated from 4 number blocks to one chart.
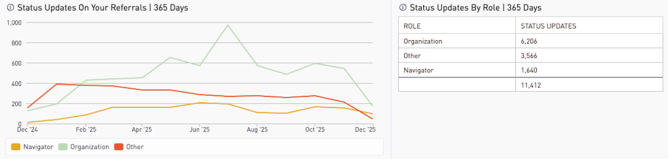
D. A tabular version of Status Updates on Your Referrals has been added.
E. The Most Referred to Programs chart is limited to the Top 50 most referred to programs.
F. Removed Sessions and Service Area charts.
Why this matters
These updates significantly improve dashboard load times and make insights easier to access and act on.