Changes to Your Dashboards
Dashboard Name: Site Activity
What's changing?
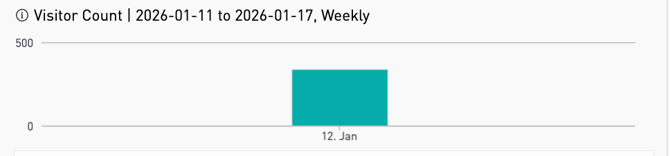
The metric currently labeled “Visitor Count” will be updated to “Total Site Traffic” to provide a more accurate description of the measure.
Current Report:
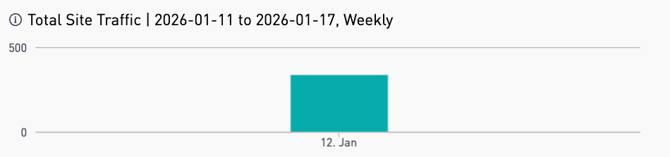
Updated Report:
-
The metric currently labeled “Visitor Count” will be updated to “Total Site Traffic” to provide a more accurate description of the measure.
Dashboard Name: Assessment Activity & Group Based Assessment Activity
What's changing?
1. Time-Series Visualization
The default data displays are adjusted to focus on longitudinal tracking.
Customer Value:
- Customers can now more easily visualize how their data points trend over time rather than looking at static snapshots.This helps users identify seasonal patterns or growth trends more effectively.
- The Average Time to Complete Assessment has been updated. It now looks at each form separately, so only similar forms are grouped together. This helps make the results more accurate and easier to understand.
Legacy Report:

Updated Report:
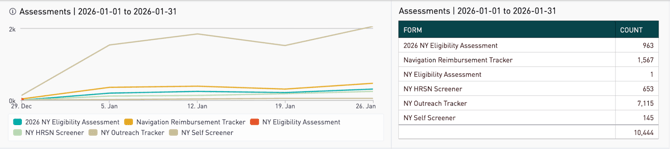
- Form type volume over time shown in both chart and data table with detailed counts by form versus aggregated and rounded totals.
- What this means for you: Increased data integrity. Statistics are now displayed on a per-form basis only.
Legacy Report:

Updated Report:
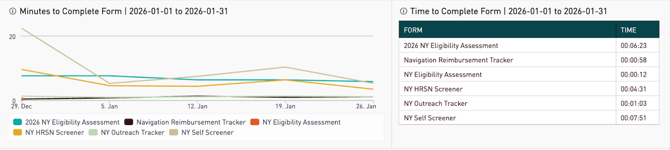
- Minutes to complete now shown over the time period filtered to.
- Minutes to complete shown in a data table by form to more accurately represent the completion times by form.
- We include forms where the start time and complete time are the same, previously these were excluded.
Legacy Report:

Updated Report:
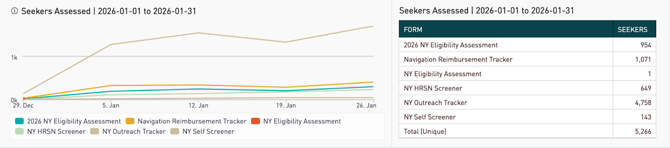
- Seekers assessed shown over the time period filtered to.
- Seekers assessed shown in a data table to illustrate number of seekers by form type.
Legacy Report:

Updated Report:
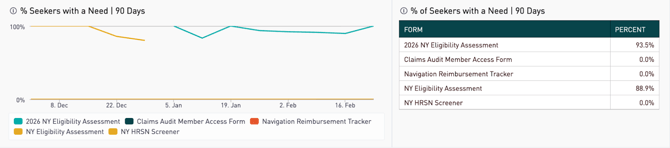
- Seekers with a need shown over the time period filtered to.
- Seekers with a need shown in a data table to illustrate percent of seekers with a need by form type.
Legacy Report:

Updated Report:
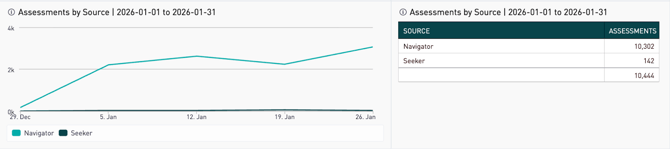
- Removed pie chart and replaced with line chart showing assessments by source over the time period filtered to.
- Addition of data table to show assessments by source totals.
Legacy Report:

Updated Report:
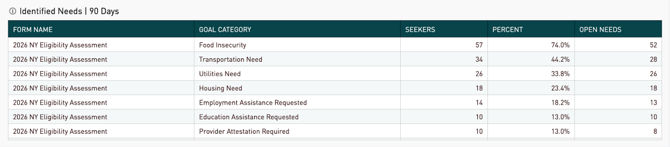
- Expanded data table for identified needs that now includes the form the need originated from.
- Percent is based on seekers evaluated on a given form, instead of across all forms.
Legacy Report:
Updated Report:
No changes to content in this section of the report.
Legacy Report:
Updated Report:

No changes to content in this section of the report.
Dashboard Name: Site Assessment Details (PII) Report & Group Based Site Assessment Details
What's changing?
1. No changes to Dashboard display elements
2. Resolved: Duplicate Form Submissions
- Bug Fix: An issue was identified where a single form submission could occasionally appear multiple times in the results is now resolved.
- What’s improved:Each unique form submission ID now displays only once.
- Customer Value:No more manual clean-up or removing duplicates from exported files. Submission counts and reports are now accurate and easier to use. If customers previously noticed inflated counts this issue has been resolved and historical data should now display correctly.
3. Refined Data Display for Form Responses
- What’s improved:When multiple answers are combined within a single form response, a space is now added on both sides of the | delimiter. Previously, responses were concatenated without spacing, which made them harder to read.
- Customer Value: Improved on-screen readability with a clear visual separator between each response.
- Support Note: If a customer exports the data and uses parsing logic (e.g., splitting on |) within their own data warehouse or downstream systems, they may need to update their logic to account for the added spaces around the delimiter.
Legacy Report:

Updated Report:

- Duplicate form submission id’s have been resolved.
Legacy Report:

Updated Report:

- Piped answers now contain a single space on each side of the “|” for readability.
Frequently-Asked Questions (FAQ)
Q: What data changes are being implemented?
A: To ensure faster load times and a more reliable experience, dashboards will now include data from the current year and the last three years.
W: Are there any UX/UI changes?
A: Yes. The dashboard includes an updated layout and refreshed color scheme. All existing features and functionality remain unchanged. The enhancements are visual and structural improvements designed to reduce clutter and make insights easier to consume.
Q: What time zone are the dates/times on forms displayed in?
A: We have now standardized all newly released forms to display in the central time zone.
Q: Are any of the metrics changing?
A: Yes, some metrics are changing with this release. See detailed descriptions here.
Q: Are the 'Logged-in Users' and 'Total Site Traffic' metrics intended to directly replace the older 'Identified Users' and 'Anonymous Users' metrics, respectively?
A: No. Logged-in Users and Total Site Traffic are new metrics designed to provide a simpler and more accurate view of overall site usage, rather than serving as direct replacements for the older metrics.
The older metrics relied on more complex identification methods that could be difficult to interpret and sometimes undercounted usage. The new metrics are designed to be easier to understand:
- Logged-in Users count users who sign in to the platform.
- Total Site Traffic measures overall site traffic based on unique browser visits (cookies), regardless of whether visitors log in or take an action.
Together, these metrics provide a clearer picture of both authenticated usage and overall site reach, without requiring customers to interpret more technical classifications like “identified” vs. “anonymous” users.